
In Part 1 of this post, I painted the picture of what a typical online African Hunting Video (HV) looks like based a random sample of 229 HVs that I watched and curated on this website.
Better late than never… here is Part 2 of the post. This post has taken a very long time to publish for many reasons (which nobody wants to hear about), but since posting 500 Hunts curated: What I uncovered, Part 1 I have remained active by watching and curating more HVs on this blog. I am well on the way to curating 1 000 Hunts and I plan on posting a similar analysis at a later stage, where I compare the differences in what I have found between 500 and 1 000 Hunts (hopefully by halfway through 2021!)
Popular hunting series available on streaming platforms such as MeatEater and Jim Shockey’s Uncharted, are 22-45 min in time length and typically showcase one Hunt or one Animal being hunted per Hunter (only considering big game). In this Part 2 of the post, I’m trying to uncover which factors make an online HV popular and engaging, by analysing the data collected from the first 229 videos curated.
If you like analytics and are interested in the numbers of online Hunting Videos, then this part of the post should be of interest to you. After a lot of number crunching, and I mean a lot, I’m beginning to get a clearer picture of which things do and don’t make an online HV “watch-worthy” and engaging.
5 points in Part 2:
- Video hosting platform metrics such as Views, Likes, Dislikes, etc., can be used to compare the overall engagement of different online Hunting Videos and the individual characteristics that make up those videos.
- Highly engaging online HVs contained 2-3 Hunts, with total view times of 10-25 min being ideal
- Size does matter, HVs with Big 5 & Dangerous 7 Animals received significantly more views compared to smaller Animal categories (and potentially less dangerous), and the Tiny 10 Animals received the most Likes and least Dislikes
- Closer is better than farther. HV’s where the following hunting weapons were used: DoubleRifle, Airgun, ArrowGun, Spear and Crossbow were found to be very popular. #TrackStalk and #SpotStalk hunting methods received more Views and Likes compared to other methods.
- The perfect recipe for a highly engaging HV: aim for 15-20 min and showcase 3 Hunts (approx. 5-7 min per Hunt). Plains game makes for interesting viewing, Dangerous game does get more views, and don’t forget to have a go at the Tiny10 (you can hunt them just about anywhere in Africa). Get close using #TrackStalk or #SpotStalk. And don’t forget to make the effort to tell a good story and to educate your viewers using your Hunting Video.
Video hosting platforms, like YouTube and Vimeo, make use of video analytics to manage how videos are shown and recommended to different viewers based on metrics like the number of video Views, Likes, Dislikes, Comments, Channel Subscribers, etc. When I watch and curate a HV I capture some of these metrics to assess how these videos are performing on these platforms. These data are not taken into consideration when making use of the HuntGaugeTM scoring system to curate videos.
I won’t go into too much detail in this post about what these metrics mean (popularity and engagement are actually different measures), but if we are to compare “apples with apples” it’s important to note that some HVs have been published online a lot longer than others and of course this will have an impact on these metrics. For example, some videos that have been posted online longer tend to have more Views than videos that have only recently been published (not always the case though). Therefore, it is important to normalise metrics by accounting for the duration that a video has been posted online, which I’ve done throughout this write-up. The number of Subscribers that a Channel or Hunting Video publisher has, was not taken into consideration here.
One last thing before we dive into the data. Three out the 229 HVs curated were removed from the dataset as outliers (except where stated otherwise). These videos had so many views that it is possible that they experienced a sort of viral-like state at some point since being published online. It’s difficult to determine what virality looks like for these types of videos, mostly because video sharing data is not readily available (important metric to determine “viral-ness”), but it would be interesting to have a closer look at these videos in a separate post.
Hunting Videos vs Hunts vs HuntGauge
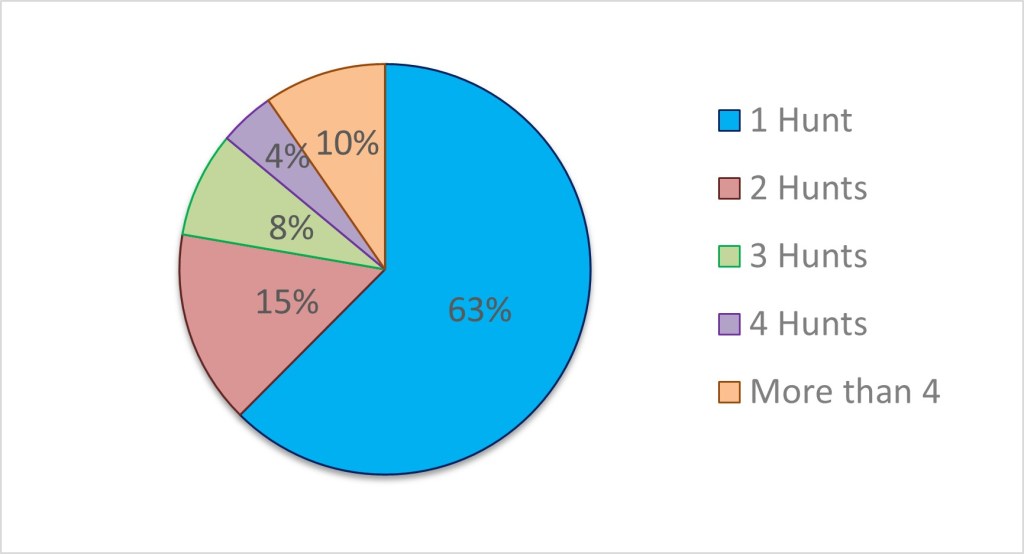
In Part 1 I explained that there is a difference between Hunting Videos (HVs) and Hunts, with some HVs consisting of more than one Hunt. Of the 229 HVs curated a maximum of 18 Hunts were shown in two of the videos. The majority of the videos showcased only one Hunt at 63%, with two, three and four Hunts at 15%, 8% and 4%, respectively (see Figure 1). Only 1 in 10 of the HV’s curated showcased more than 4 Hunts.
What is more insightful is if we analyse the number of Views and Likes a HV had received by the number of Hunts shown in the video. Figure 2 shows the results of this analysis where most Views and Likes were observed at two and three Hunts with very similar values. Even though the majority of HVs curated contained only one Hunt (63%), these videos received almost half the number of Views and almost 20% fewer Likes when compared to 2-3 Hunt videos. More than three Hunts resulted in significantly fewer Views and Likes. This suggests that viewers like to watch multiple Hunts in a HV and that there is an upper limit to this beyond which this factor is negated.

The HuntGaugeTM (HG) score is calculated using a scoring system I developed for use on this blog, you can read more about it here. In conceiving of the HG system, I never made use of any of video analytics or metrics-data I captured. So, I thought it would be interesting to see how the HG score stacks up against video View and Like data. Figure 3 shows HG score in 25-point increments plotted against Views and Likes, with Figure 3A showing only HVs with one Hunt and 3B showing data from all HVs (outlier video data omitted). There is a strong general trend where increasing HG score resulted in a commensurate increase in Views and Likes, across both datasets analysed.
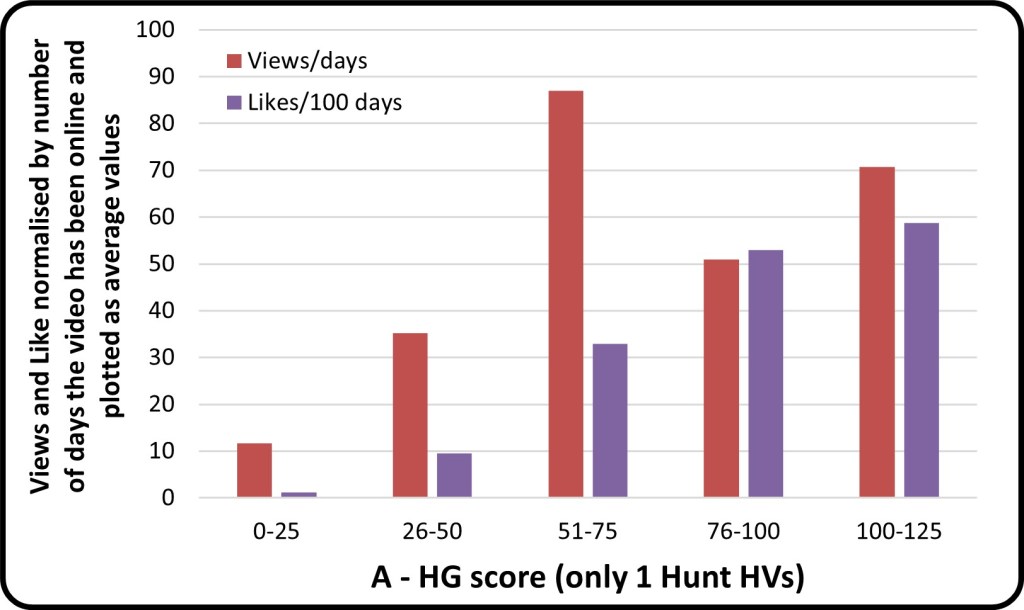
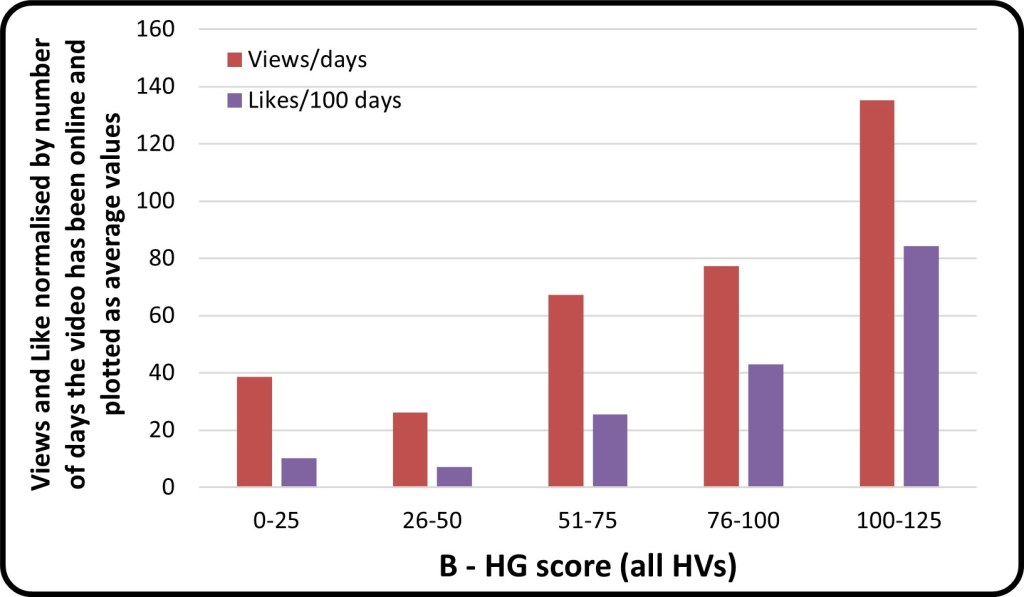
I did not expect to find such a strong association between HG score and video metrics, Views and Likes. When I first attempted this analysis I used the following HG score categories, namely HG Bronze, HG Silver, HG Gold and HG Platinum, which are 66-80, 81-95, 96-110, 111-125 points, respectively. Any scores below 66 points were grouped together as non-HG qualifying. The Views and Like data in these categories were too sparse to yield meaningful averages, and also considering that I have yet to curate a HG Platinum HV (111-125 points), I opted to present this analysis using 25-point increments instead.
The other potential consideration is that average values were calculated simply (statistical measures such as variance, standard deviation, significance, etc. are ignored here for simplicity sake) and no attempt was made to calculate weighted HG scores for HVs containing multiple Hunts. Weighting would have to be done by using the view-times of scored Hunts to proportionally assign scores to the full HV based on their time contribution to the total view-time of the HV. I’ll have to crunch these numbers when I reach 1 000 Hunts curated.
Goldilocks time: Not too long and not too short
A video’s total viewing time, or the time elapsed to view to the end of the video, is probably one of the most important considerations when making highly engaging and entertaining Hunting Videos for posting online. Figure 4 shows the average distribution of Views and Likes by 5 min total viewing-time intervals. There appears to be a broader time range of between 11-25 min that is associated with significantly higher Views and Likes compared with shorter or longer total view-times. The sweet spot seems to be 21-25 min, but I’m sure with more data we might find that this sweet spot is closer to 16-20 min based on the overall distribution of the data.
When we consider the view-times of the 53 HVs where two or three Hunts were shown in the video (see Figure 2), there is some substantiation of this result with 66% of these HVs falling within 11-25 min. Of all the HVs with 11-25 min, 43% of these videos were 2-3 Hunt-HVs (approximately 5-8 min per Hunt).

The real stars of the Hunt: Animals
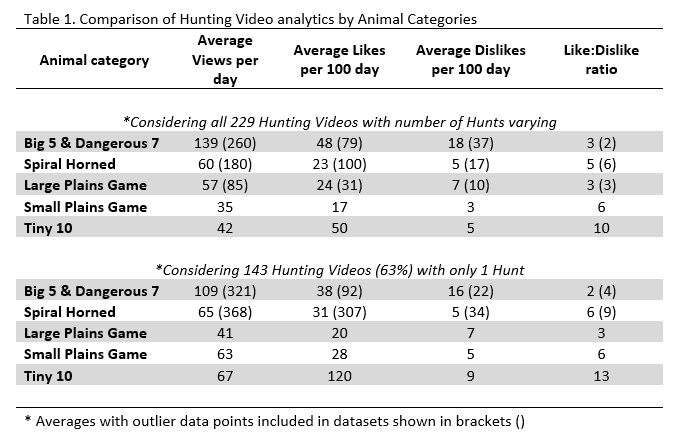
Africa is known for having a wide variety of different Animal species but are Hunting Videos containing certain Animal species more popular or engaging than others? The type of Animals being hunted and the associated HV analytics were analysed at a high level using the following HuntGauge Animal categories: Big 5 & Dangerous 7, Spiral Horned, Large Plains Game, Small Plains Game, and Tiny 10. Table 1 shows a breakdown of this analysis using both the full dataset of 229 HVs (500 Hunts) and smaller dataset of 143 HVs (only one Hunt per HV, therefore 143 Hunts in this dataset), with outliers removed. Data shown in bracket represents datasets with outliers included.
A similar high-level trend was observed between both the full (229 HV) and reduced (143 HV) datasets. Videos containing Big 5 & Dangerous 7 Animals, either standalone (143 HVs) or with different animals (229 HVs), received 2-4 times more Views compared with other categories. The Big 5 & Dangerous 7 category also received high Likes but also received significantly more Dislikes compared to the other categories. A clear trend can be seen when comparing Like:Dislike ratio, where for every Dislike received this category received 2-3 Likes. Large Plains Game also yielded a similar result. Spiral Horned and Small Plains game received 5-6 Likes for every Dislike received. The category with the greatest Like:Dislike ratio was the Tiny 10, where for every Dislike these videos received 10-13 Likes. Despite receiving significantly fewer Views, compared to Big 5 & Dangerous 7, this category reived significantly higher Likes, especially when showcased by themselves in single Hunt videos, yielding more than four times more Likes. It seems bigger may be better when it comes to being seen (i.e. Views) but the tiny guys really do pack a punch when it comes to being appreciated (i.e. Likes).
These Animal analysis results can be used to further interrogate the previous result where the number of Hunts at which maxima Views and Likes was observed to be at 2-3 Hunts (see Figure 2). If we analyse the Animal categories in 2-3 Hunt-HVs within the dataset we get a sample of 123 Hunts. Animal categories in this sample of videos were represented at 24%, 22%, 20%, 24% and 11%, for Big 5 & Dangerous 7, Spiral Horned, Large Plains Game, Small Plains Game and Tiny 10, respectively.
This fairly even distribution suggests that the number of Hunts showcased in a Hunting Video, and/or the viewing-time of the HV, may be more significant than what type of Animals are being hunted in a video when it comes to higher Views and Likes. A closer look at specific Animal species will have to be done to get to more detailed insights about this Hunting Video factor (for another post).
Hunting Weapons and methods
As mentioned in Part 1 of this post, the dominant Hunting Weapon showcased in the 500 curated Hunts is the Rifle at almost 80%. The Bow was the second most common at almost 14%, and the balance was comprised of the following weapon types by most to least common, namely: Shotgun, Handgun, DoubleRifle, Arrowgun, Crossbow, Airgun and Spear. Despite only having curated 11 Hunts in total showcasing DoubleRifle, Arrowgun, Crossbow, Airgun and Spear, these associated Hunting Videos received significantly more View and Likes compared to the other listed weapons (data not shown). Interestingly, the Handgun and Shotgun Hunts received the least average Views and Likes, with Bow and Rifle Hunts in the middle of the dataset. To determine if these results are significant, more Hunts showcasing these less common weapon types will be curated for the next 500 Hunts on this blog.
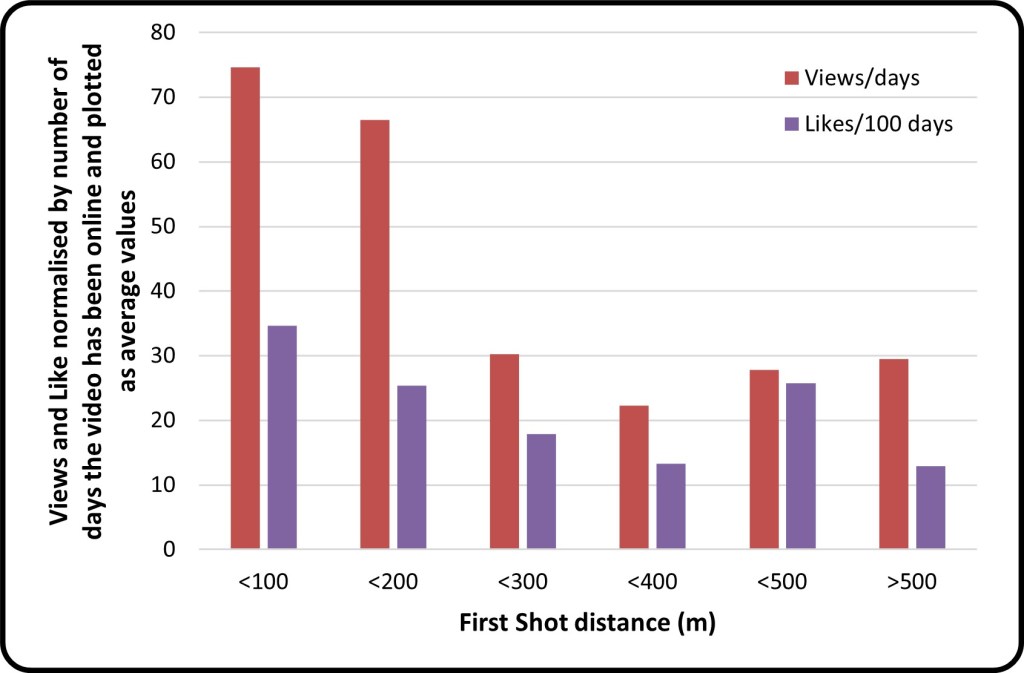
It is probably not surprising that the underlying factor in this dataset is the distance between the Hunter or Huntress and their quarry. Weapons such as Spears requires the Hunter to be literally on top of the Animal (usually in a #AmbushBaited #TreeStand), whereas for #LongRange rifle used by a well-trained and competent Huntress, the distance can be more than 500 m. These situations make for very different Hunting Videos and viewing experiences. So, we should bear distance in mind when considering the choice of hunting weapon.
Figure 5 shows the approximate distance of the First shot in the Hunt. Second shots or follow-up shots are not taken into consideration here. Approximating distances on video is by no means an exact science, and I must stress that the distances are approximate (sometimes the distance of the First shot is mentioned in the HV, but most of the time it must be estimated), and that’s why distance increments of 100 m are plotted. The most Views and Likes are observed at a distance of 100 m or closer, followed closely by shots shorter than 200 m. There is a very significant decrease in both Views (more than 50%) and Likes (almost 30%) when increasing the distance to 200-400 m. There is a slight increase in these HV metrics when the distance is greater than 400 m. This slight increase can be attributed to the recent trend and increasing popularity in #LongRange hunting, where specialized rifles and equipment are used to achieve ethical shots on Animals at great distances.
The Hunting Method can also be analysed using Hunting Video metrics and the results of this can be seen below in Table 2. The most common Method showcased in the 500 Hunts curated was #WalkStalk, followed by #Ambush type methods (these include #AmbushBait, #AmbushWaterHole, #AmbushBlind, #AmbushDriven, #AmbushCalling, etc.). The following two methods received the greatest number of Views and Likes, namely #TrackStalk and #SpotStalk, whereas #VehicleBased and #HikeStalk received the least. Both #TrackStalk and #SpotStalk require more skill and deliberate effort to close the distance between the Hunter and the Animal, whereas #VehicleBased requires least amount of physical effort on the part of the Hunter and the shots from vehicles tend to be further out so as to avoid spooking the Animal too much. Although #HikeStalk, which is essentially #WalkStalk through mountainous or hilly terrain, does require more physical effort than other methods, the shots on animals (all with rifles) tend to be at greater distances compared to #WalkStalk and are usually taken across valleys where the Animals are located opposite to the Hunting team. In terms of Like:Dislike ratios, #HuntingDogs and #VehicleBased received the lowest ratio (i.e. most Dislikes to Likes), whereas #LongRange and #HikeStalk received the highest ratios (i.e. least Dislikes to Likes).

Tags, tags, tags everywhere!
I have made use of existing tags found commonly on various social media platforms and have also created new HuntGauge tags for specific use here in curating Hunting Videos (put a # in front and you can call it a hashtag if you want). There are 123 tags in total and these are divided into three categories that describe the following key aspects of Hunting Videos: Hunting, Storytelling and Educating. Hunting tags are used to categorise and describe the details regarding the Hunt, such as things like the hunting method, weapon, terrain, etc. Storytelling tags describe how the Hunting Video was made or produced and include things such as different cameras used, audio quality and editing of the raw footage. Lastly, the Educating or Educational tags deal with informative or information sharing parts of a Hunting Video that deals with the Hunt specifically, hunting conservation in general, the biology of the animals and the habitat they live in, etc.
Figure 6 shows a word cloud of the most common tags observed across the 500 Hunts curated. And yes, the word cloud is in the shape of the African continent (sort of… I tried).

Figure 6. Word cloud of all the different HuntGauge tags. The bigger the tag the more it occurred when curating the 500 Hunts over the 229 Hunting Videos
Table 3 shows the three most and least common tags used grouped by the by the three categories. A more detailed description of each of these tags can be found here. More HVs need to be curated to accurately assess if some of these HG tags are more or less prevalent with more popular and engaging HVs.
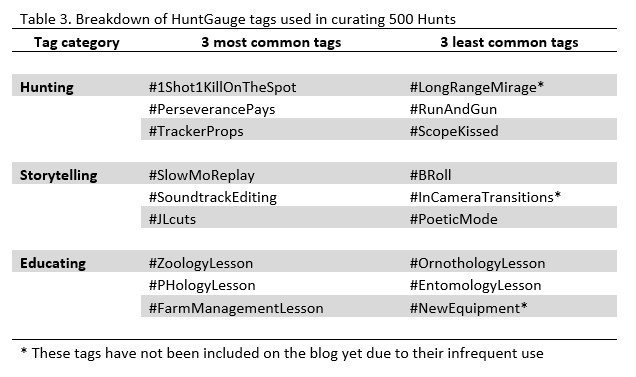
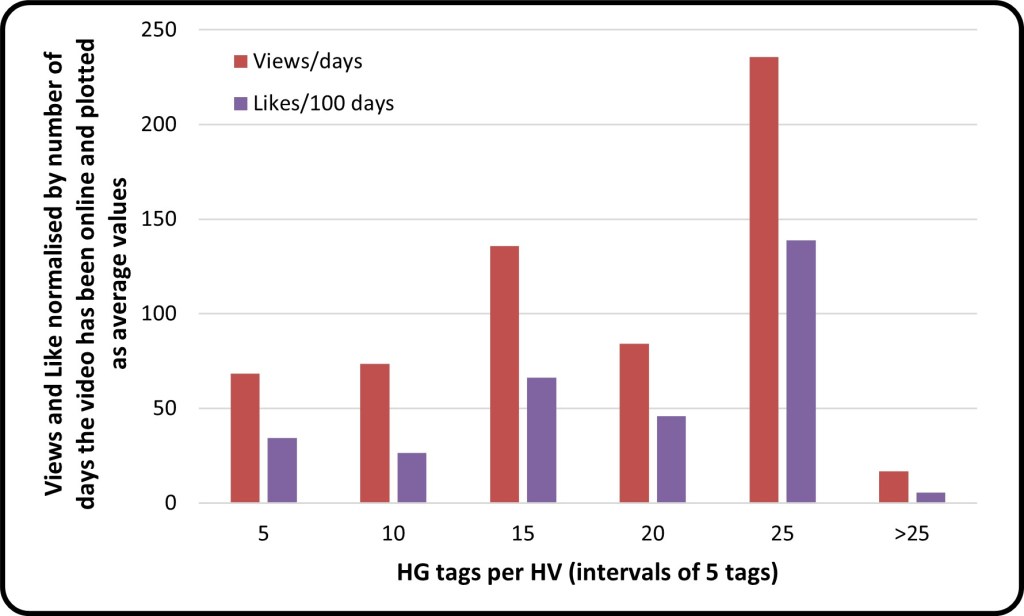
Figure 7 show the relationship between the total number of HuntGauge tags given to a Hunting Video and its View and Like metrics. Total HuntGauge tags are inclusive of Hunting, Storytelling and Educating tags (see examples in Table 3 above). With an increase in the number of tags, plotted in 5 tags intervals, there is a commensurate increase in View and Likes, in general and up to 25 tags.
There were three HVs that comprised the >25 datapoint seen in Figures 7. A closer look at these HVs showed that 7-13 Animals were hunted, far above the optimum number of 2-3 Animals (see Figure 2). This result suggests strongly that editing or cutting a full HV into smaller parts, representing several HVs of 2-3 Hunts each, may be a better approach if Views and Likes are to be maximised.
The view times of these HVs ranged from 22-58 min, with a Hunt view time range per Animal of 2.5-4.5 min. These Hunt view times tend to below the ideal view time of approx. 5-8 min, where for 2-3 Hunts the ideal HV total view time range is 10-25 min (see Figure 4.)
Two of the three HVs had no Hunts that qualified for HG score categories Bronze-Platinum (all below 66 points), and one video had only 5 HG Bronze qualifying Hunts out of the 14 Hunts that made up the total video. This result supports the need for something like a HuntGauge scoring system (see Figure 3), as assessing tags alone, where these three HVs all had the most tags at >25, won’t provide a complete picture of what a quality or “view-worthy” Hunting Video looks like.
Conclusion
I concluded this statement in Part 1 and I’ll conclude it here in Part 2 again: Hunting Videos are not just about the hunting, they are also about storytelling and educating viewers. Variety is the spice of life, so showcasing a little Animal variety (2-3 Hunts/Animals) in your Hunting Videos makes them tastier to the viewer’s eyes. It appears that the ideal view-time for a Hunt is 5-8 min (10-25 min total view-time), and viewers prefer situations where the Hunter makes the effort to get nice and close to the Animal (under 100 m). The recipe for the perfect Hunting Video is taking shape, some of the conclusions here will be re-evaluated against a larger dataset of 1 000 curated Hunts (coming soon!)
Cheers and #FilmYourHunt
HG Guy
